flowchart TB
subgraph docker[Docker]
  airflow[Airflow]
  etl[ETL]
  spark@{ shape: procs, label: Spark}
  dask@{ shape: procs, label: Dask}
  clickhouse[(ClickHouse)]
  filesystem[(filesystem)]
  superset[Superset]
  nginx

  airflow -- trigger --> etl
  airflow -- trigger --> spark
  airflow -- trigger --> dask
  spark -- read --> clickhouse
  spark -- write --> filesystem
  dask -- read --> clickhouse
  dask -- write --> filesystem
  superset -- read --> clickhouse
  nginx -- proxy --> superset
end

operator[[Operator]]
operator -- view --> nginx
operator -- view --> filesystem

opensky@{ shape: cloud, label: "OpenSky Network"}
etl -- pull ---> opensky
etl -- write --> clickhouse

receivers@{ shape: procs, label: "ADS-B receiver" }
opensky --- receivers
Python
ClickHouse
Apache Airflow
Apache Spark
Dask
Apache Superset
Fleet collects real-time aircraft state information over time, stores it, and analyzes it in bulk to infer statistical metrics – currently, air traffic density and airport safety.
Data source
Fleet collects data from OpenSky Network – a volunteer organization that connects ADS-B receivers to identify and localize all currently active civil aircraft within range. Fleet periodically pulls data and receives the following state for each aircraft:
- ICAO24 code (a unique aircraft identifier)
- Time of last state update
- Geographical coordinates
- Barometric and geometric altitude
- Velocity over ground, heading, and vertical rate
- Airborne / on-ground state
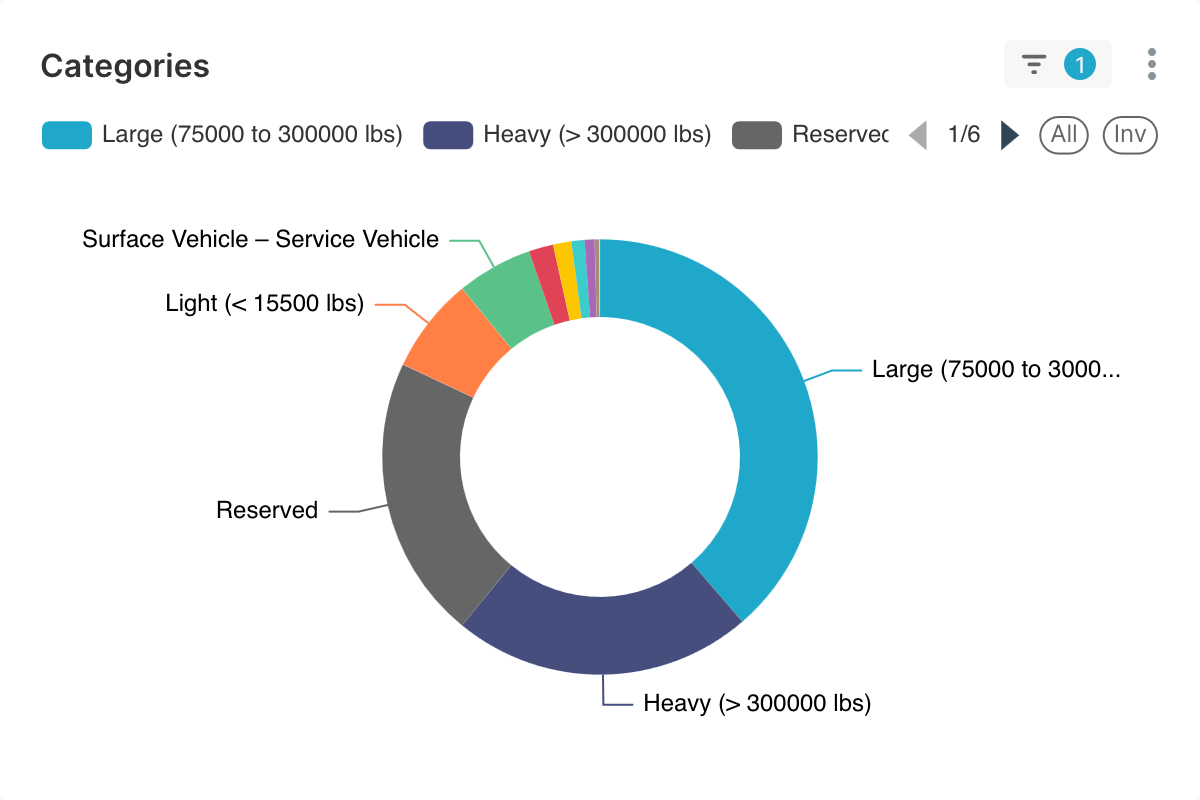
- Aircraft category, country of origin, transponder squawk code, and miscellaneous other data
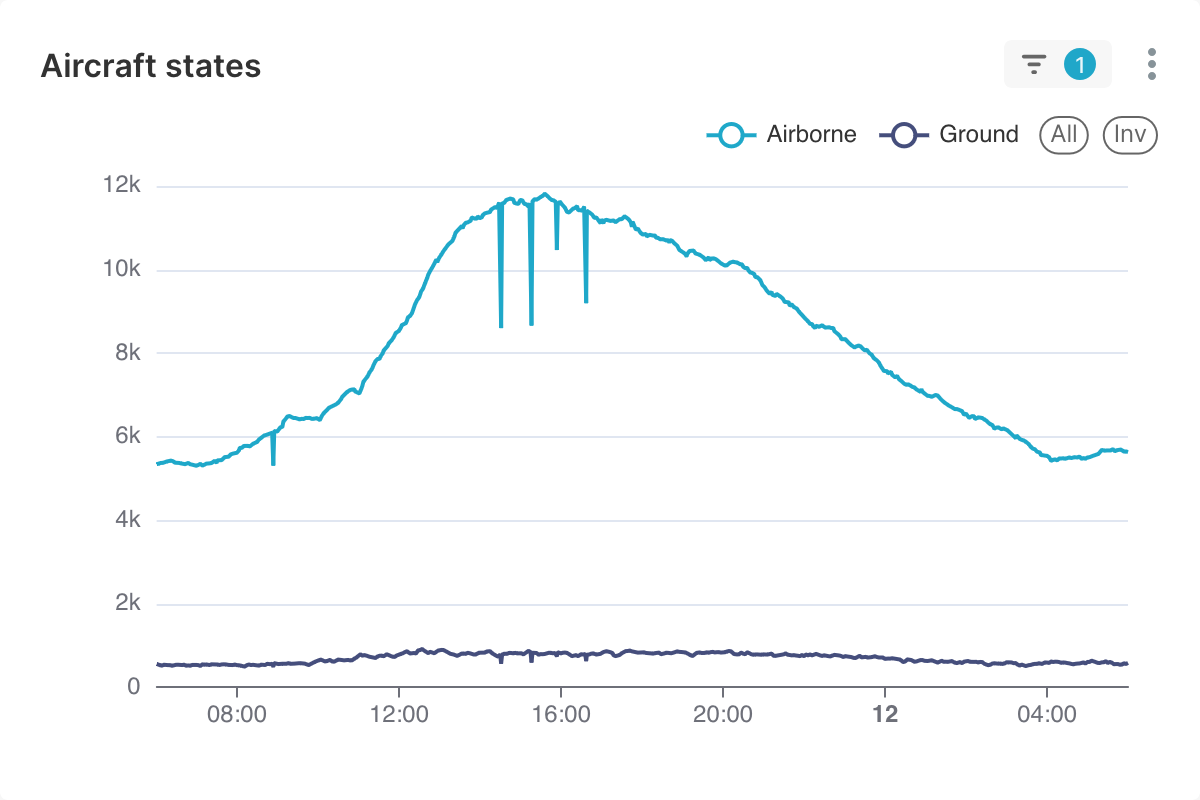
The polling interval is 90 seconds – this is chosen to fit into OpenSky’s rate limit of 1000 requests per day. A typical response returns 6,000 to 12,000 aircraft states, which accumulate about 10 million records per day in the database.
Processing
Due to the potentially large data volume, Fleet uses:
- ClickHouse for data storage and retrieval
- Apache Spark and Dask clusters for processing and analysis
Apache Superset is used for exploratory data visualization and monitoring.
System architecture
Airport safety analysis
Goals:
- Define a risk factor as an inverse metric of airport safety
- Determine the locations of all airports (they are not known in advance)
- Compute the risk factor for each airport
Risk factor
The risk factor is defined as the ratio of the number of go-around maneuvers near an airport, to the number of landings at the same airport. A go-around maneuver is performed when a landing is not going according to plan, and therefore indicates difficulty. High ratios of go-arounds to landings indicate (in my understanding) frequent problems during landing approaches. Risk factors can be greater than 1 and are clamped for visualization purposes.
Airport locations
Fleet determines airport locations from the centroids of the clusters of landing points, where aircraft states change from airborne to on-ground. The DBSCAN algorithm is used because the number of airports is not known in advance. The clustering is performed in Robinson projection, as a compromise to maintain similar scale globally and allow the use of Euclidean distance. The algorithm parameters are neighborhood radius = 5 km and minimum number of points = 5.
Go-around detection
Go-arounds are steep climbs, following descents without landing, close to ground level and to airports. Fleet detects go-arounds from the local minima of barometric altitudes (above sea level), where altitude above ground level < 500 m and distance to nearest airport < 5 km. Altitude above ground level is computed as the difference between barometric altitude and the interpolated Earth elevation from the SRTM15+V2.7 dataset. The elevation data has 6-arc-minute resolution and is interpolated linearly for speed.
Results
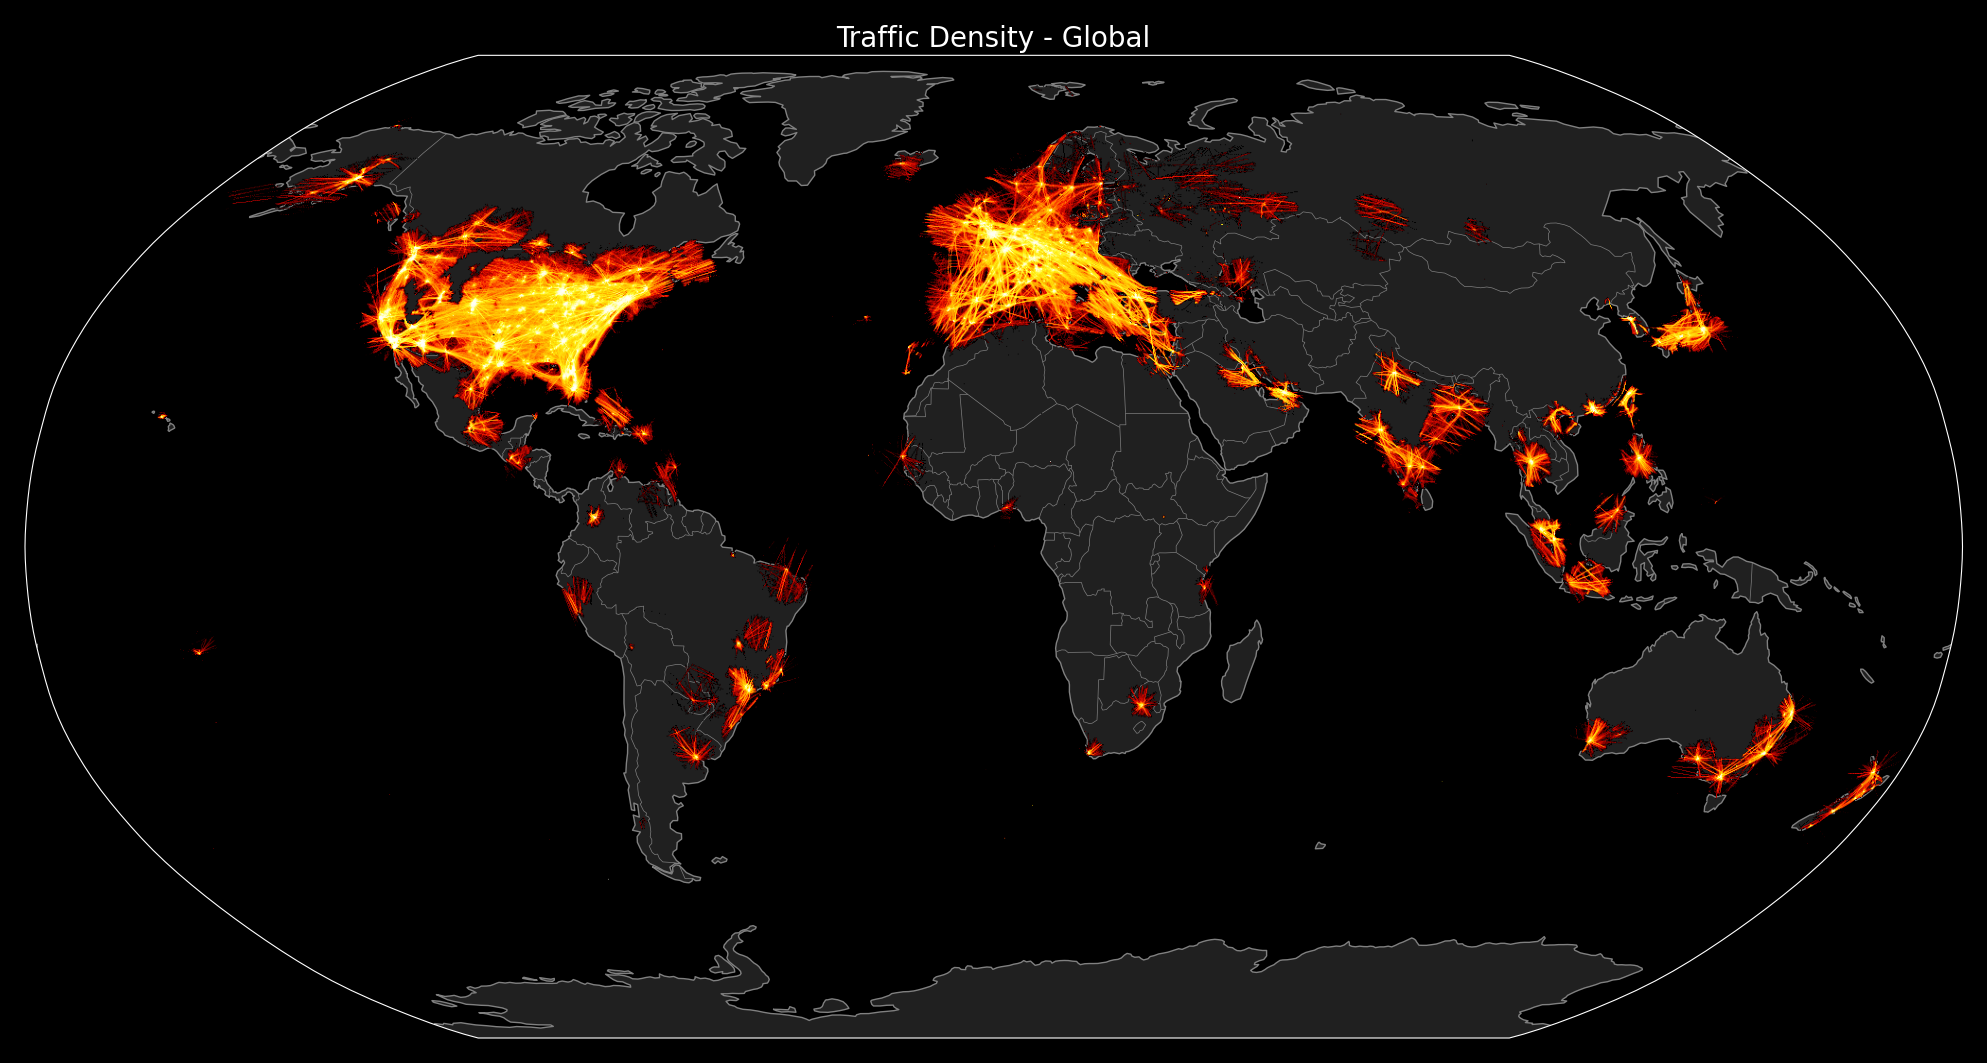
The following plots were produced with data from June 10, 2025. Click the figures to enlarge them.
Traffic density
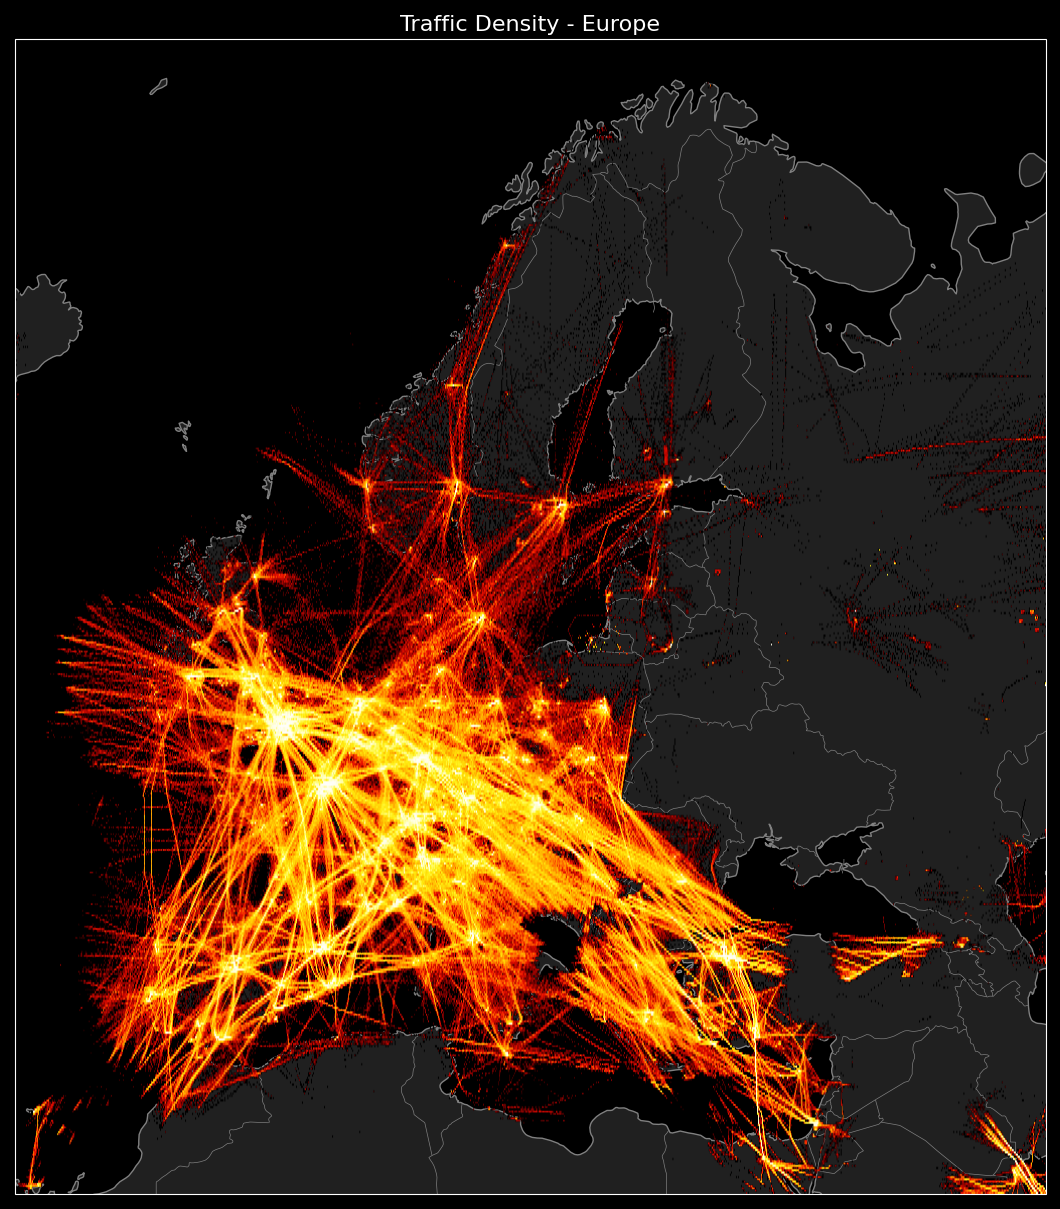
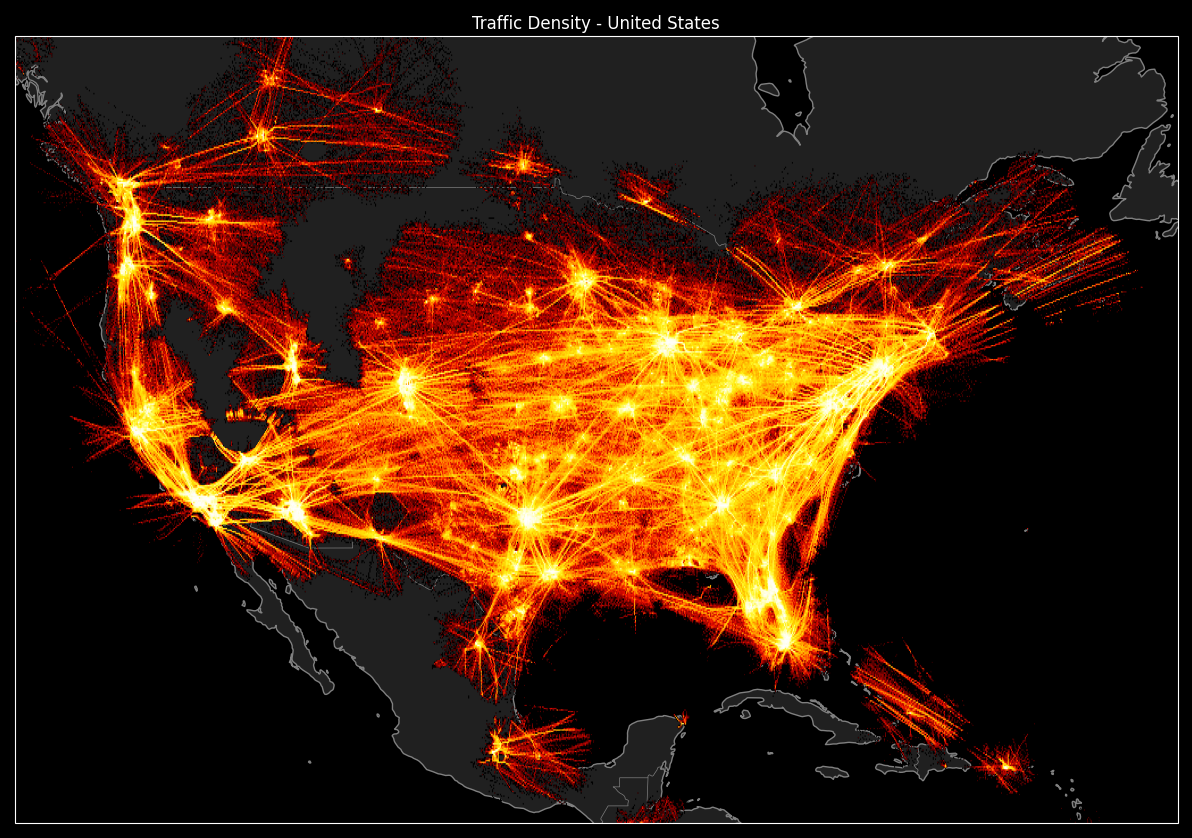
Unfortunately, traffic above the oceans cannot be observed. The data is collected by a network of volunteers using ADS-B receivers, which (to my knowledge) have a typical range of 250 km. Hence the gaps over water and the incomplete country coverage.
Airport safety
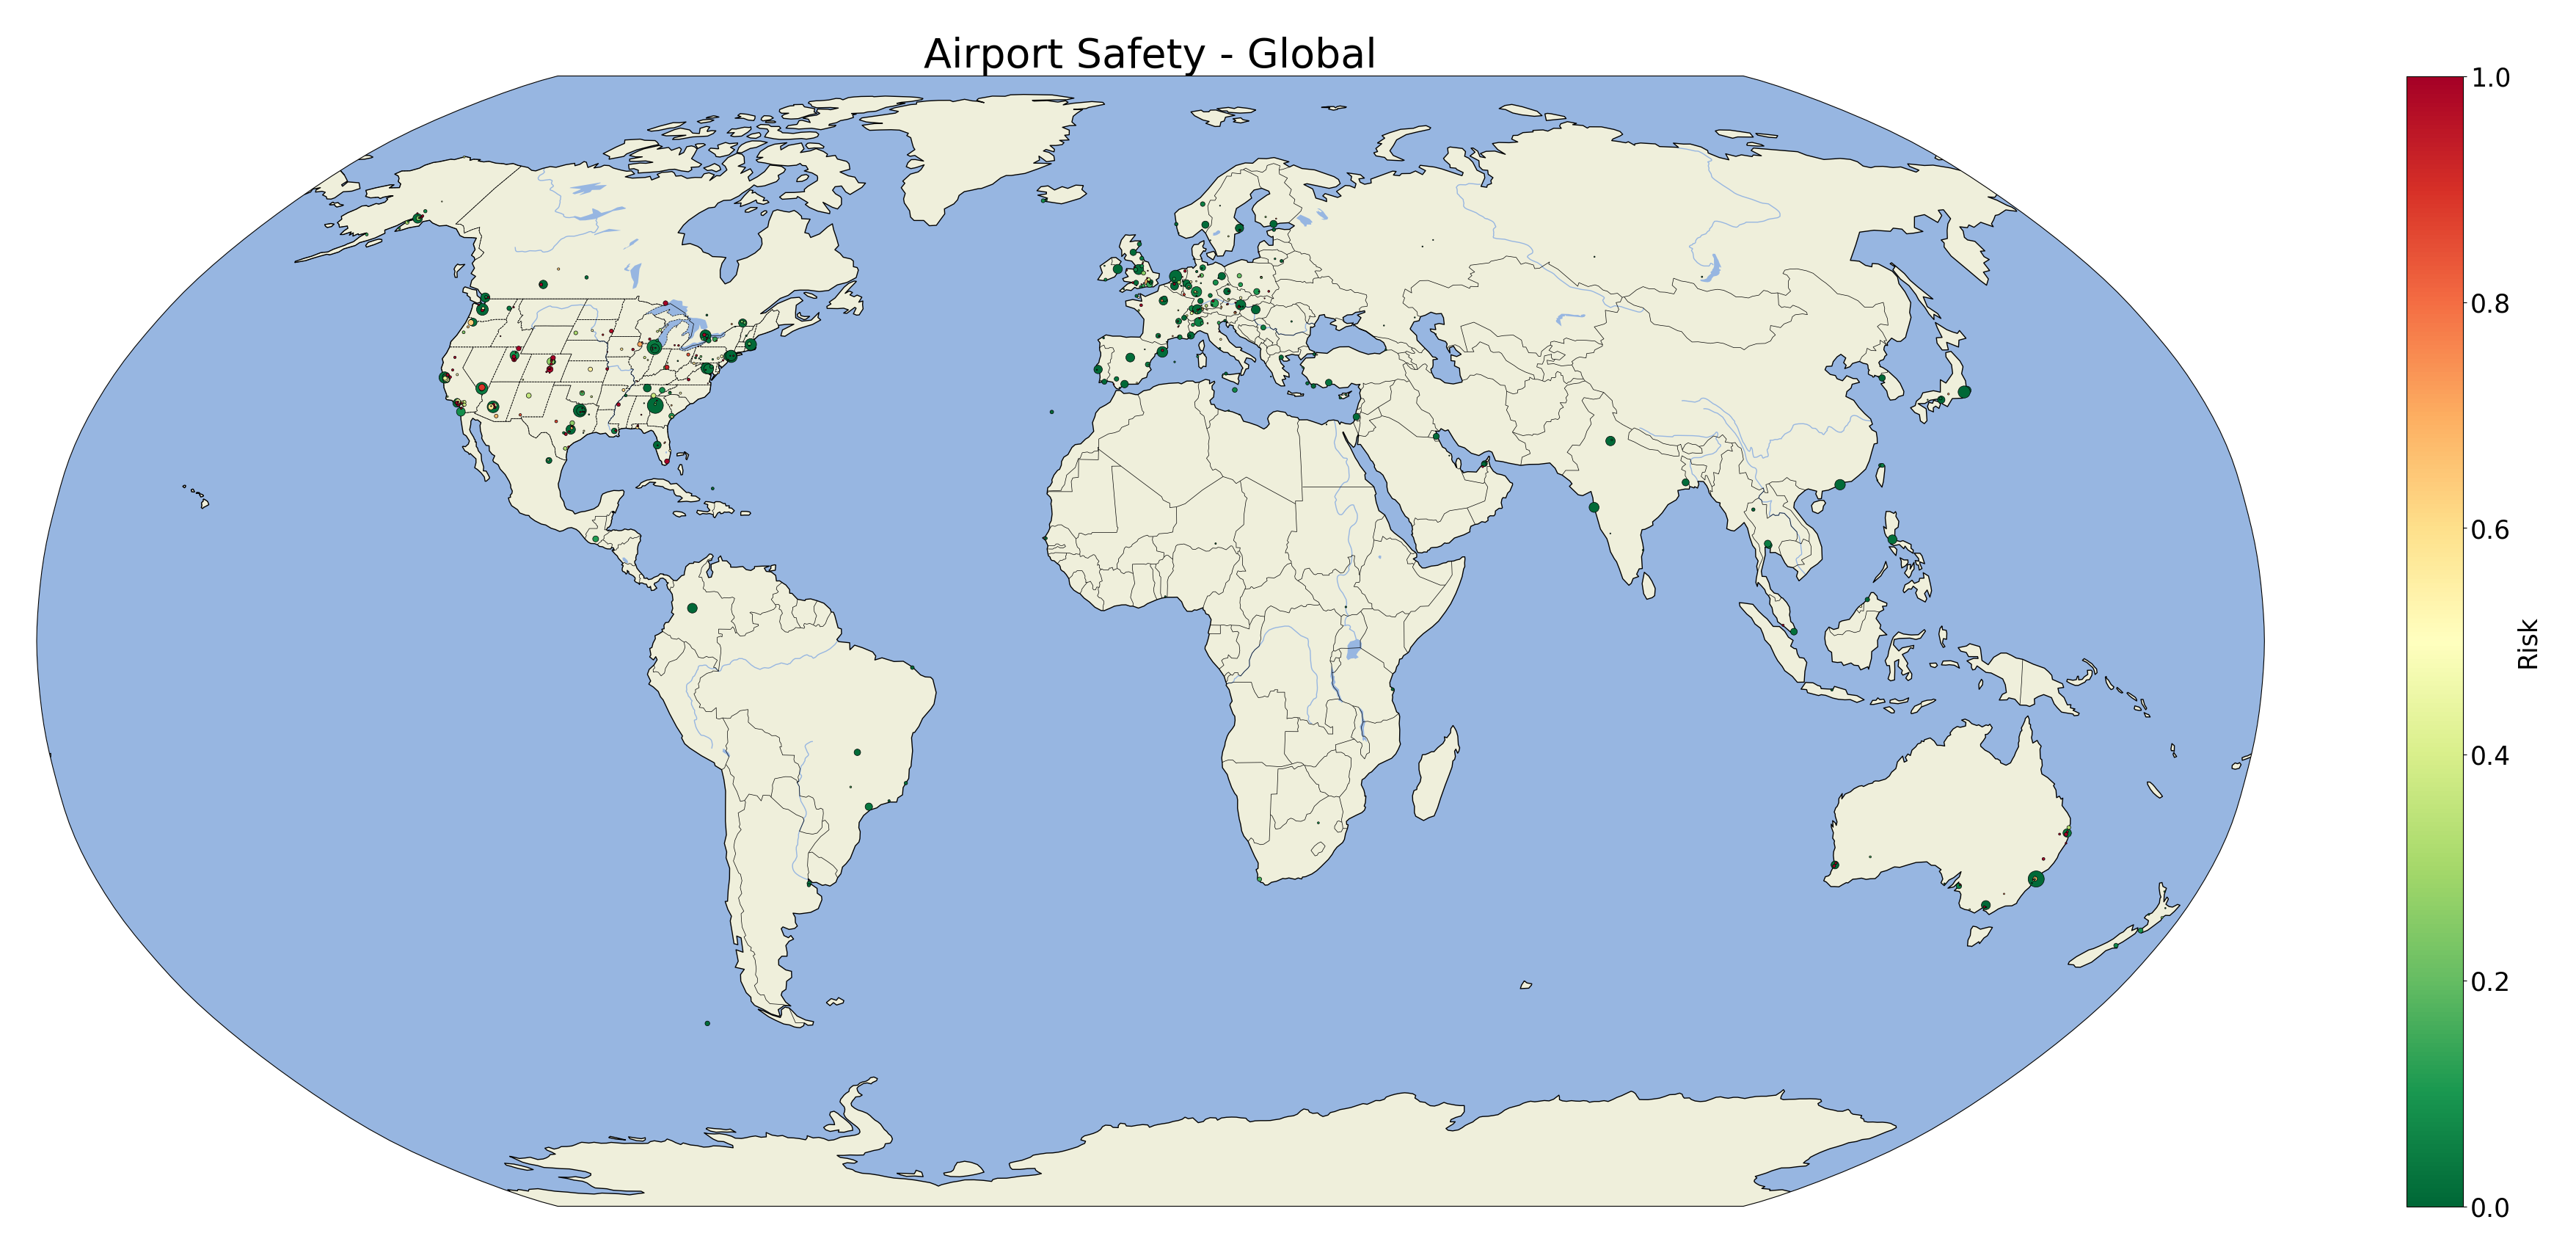
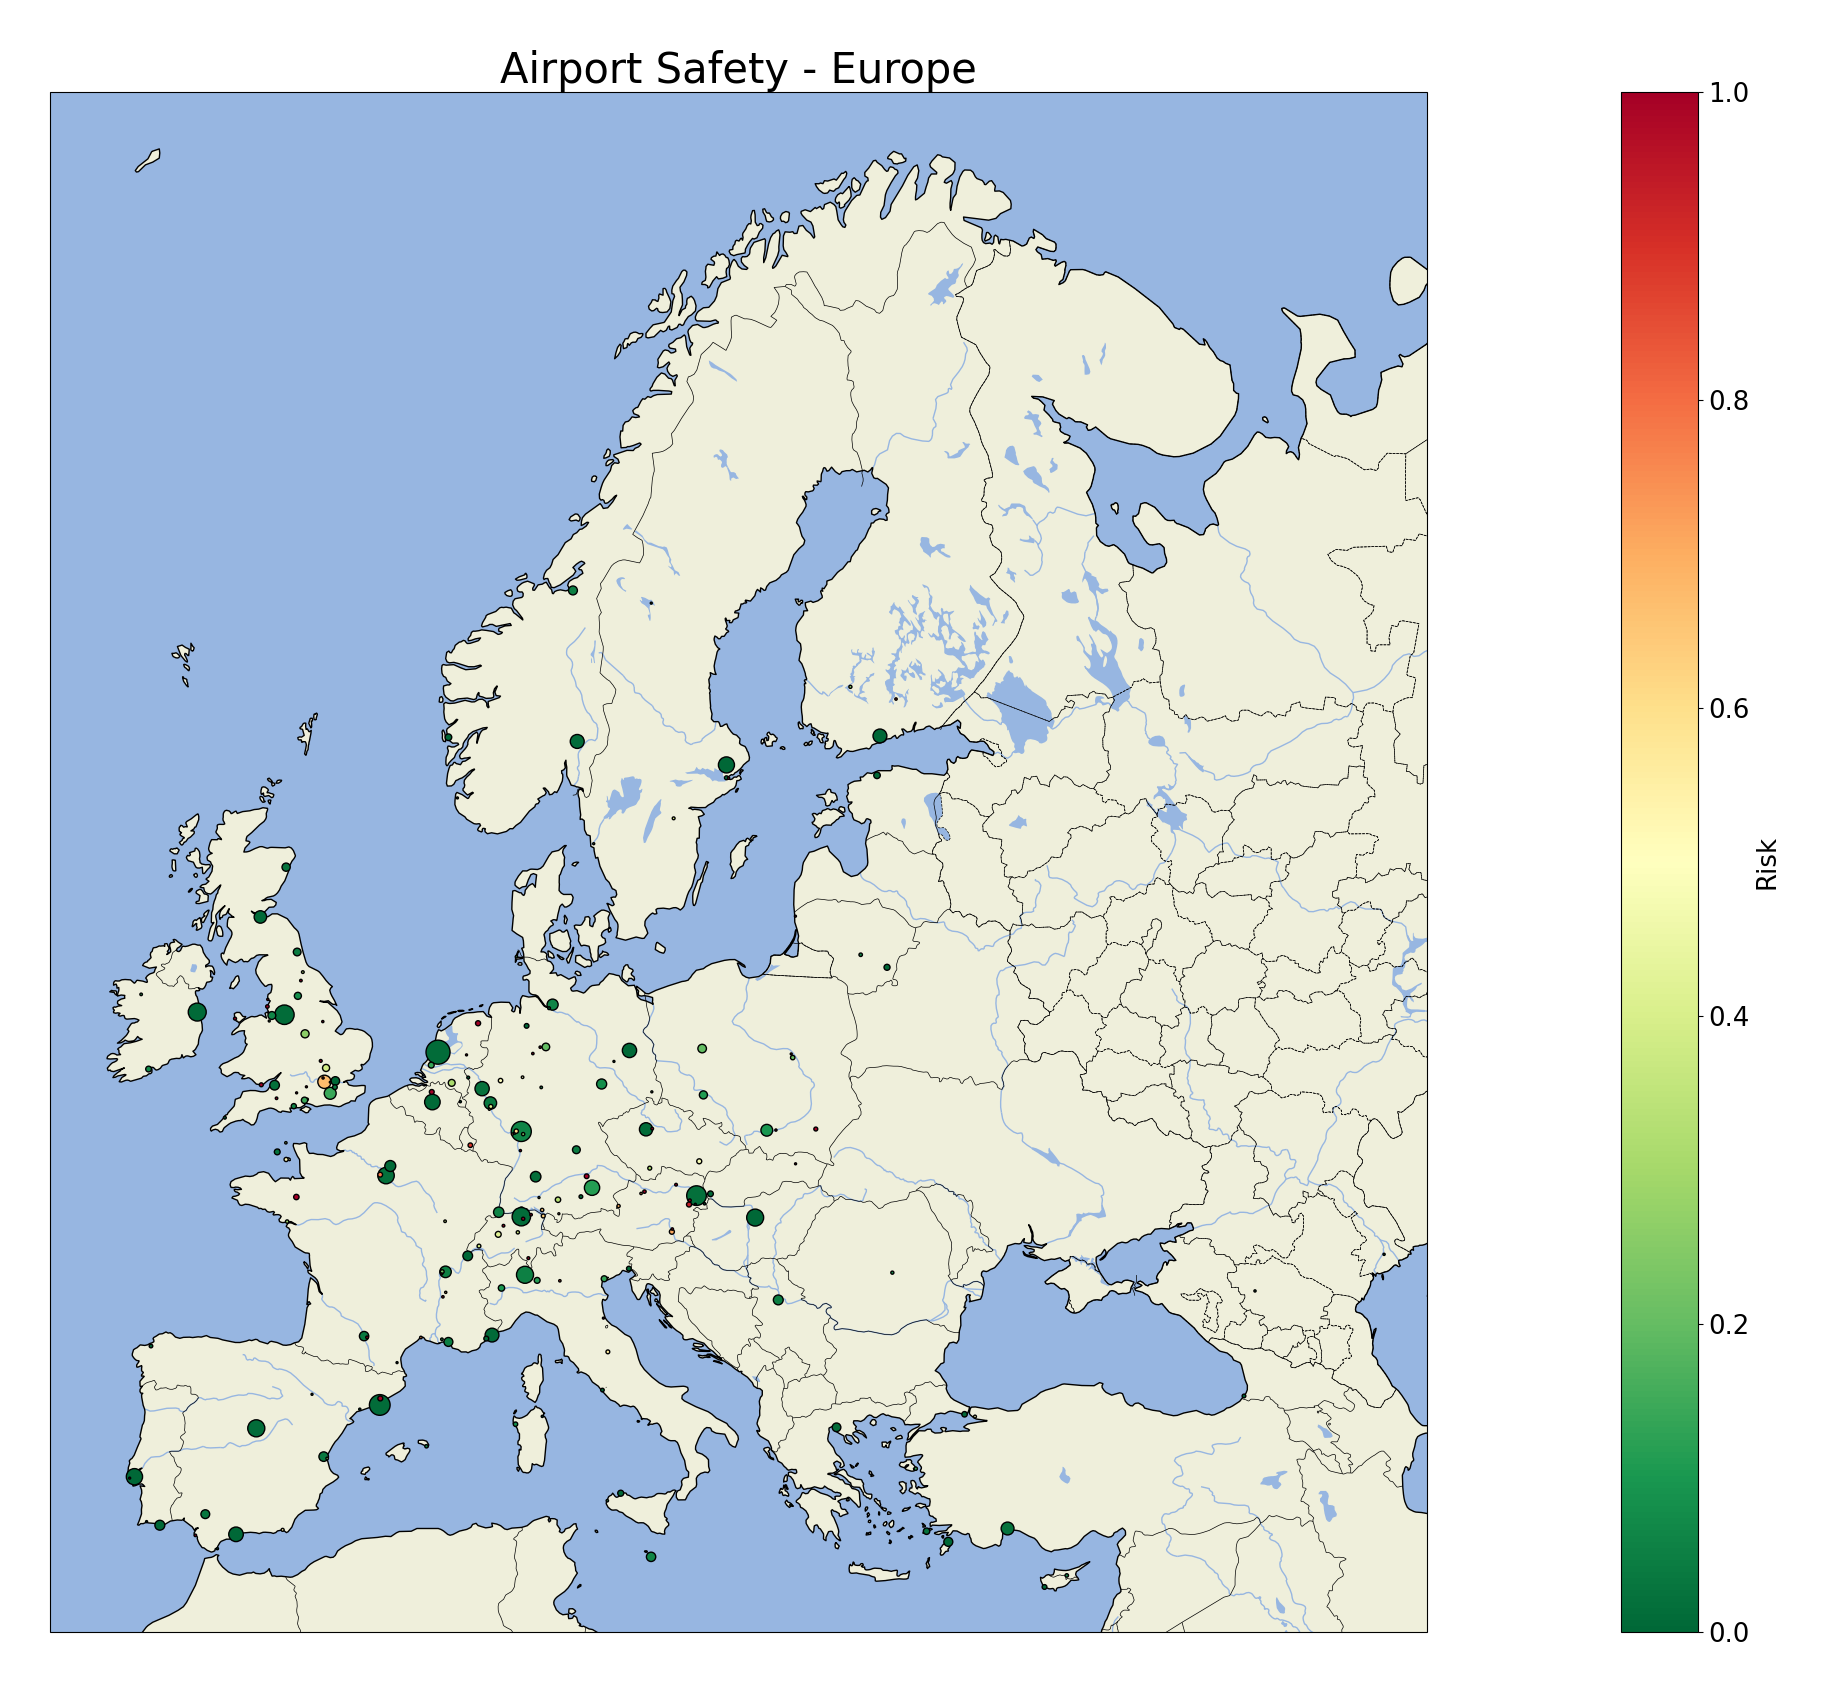
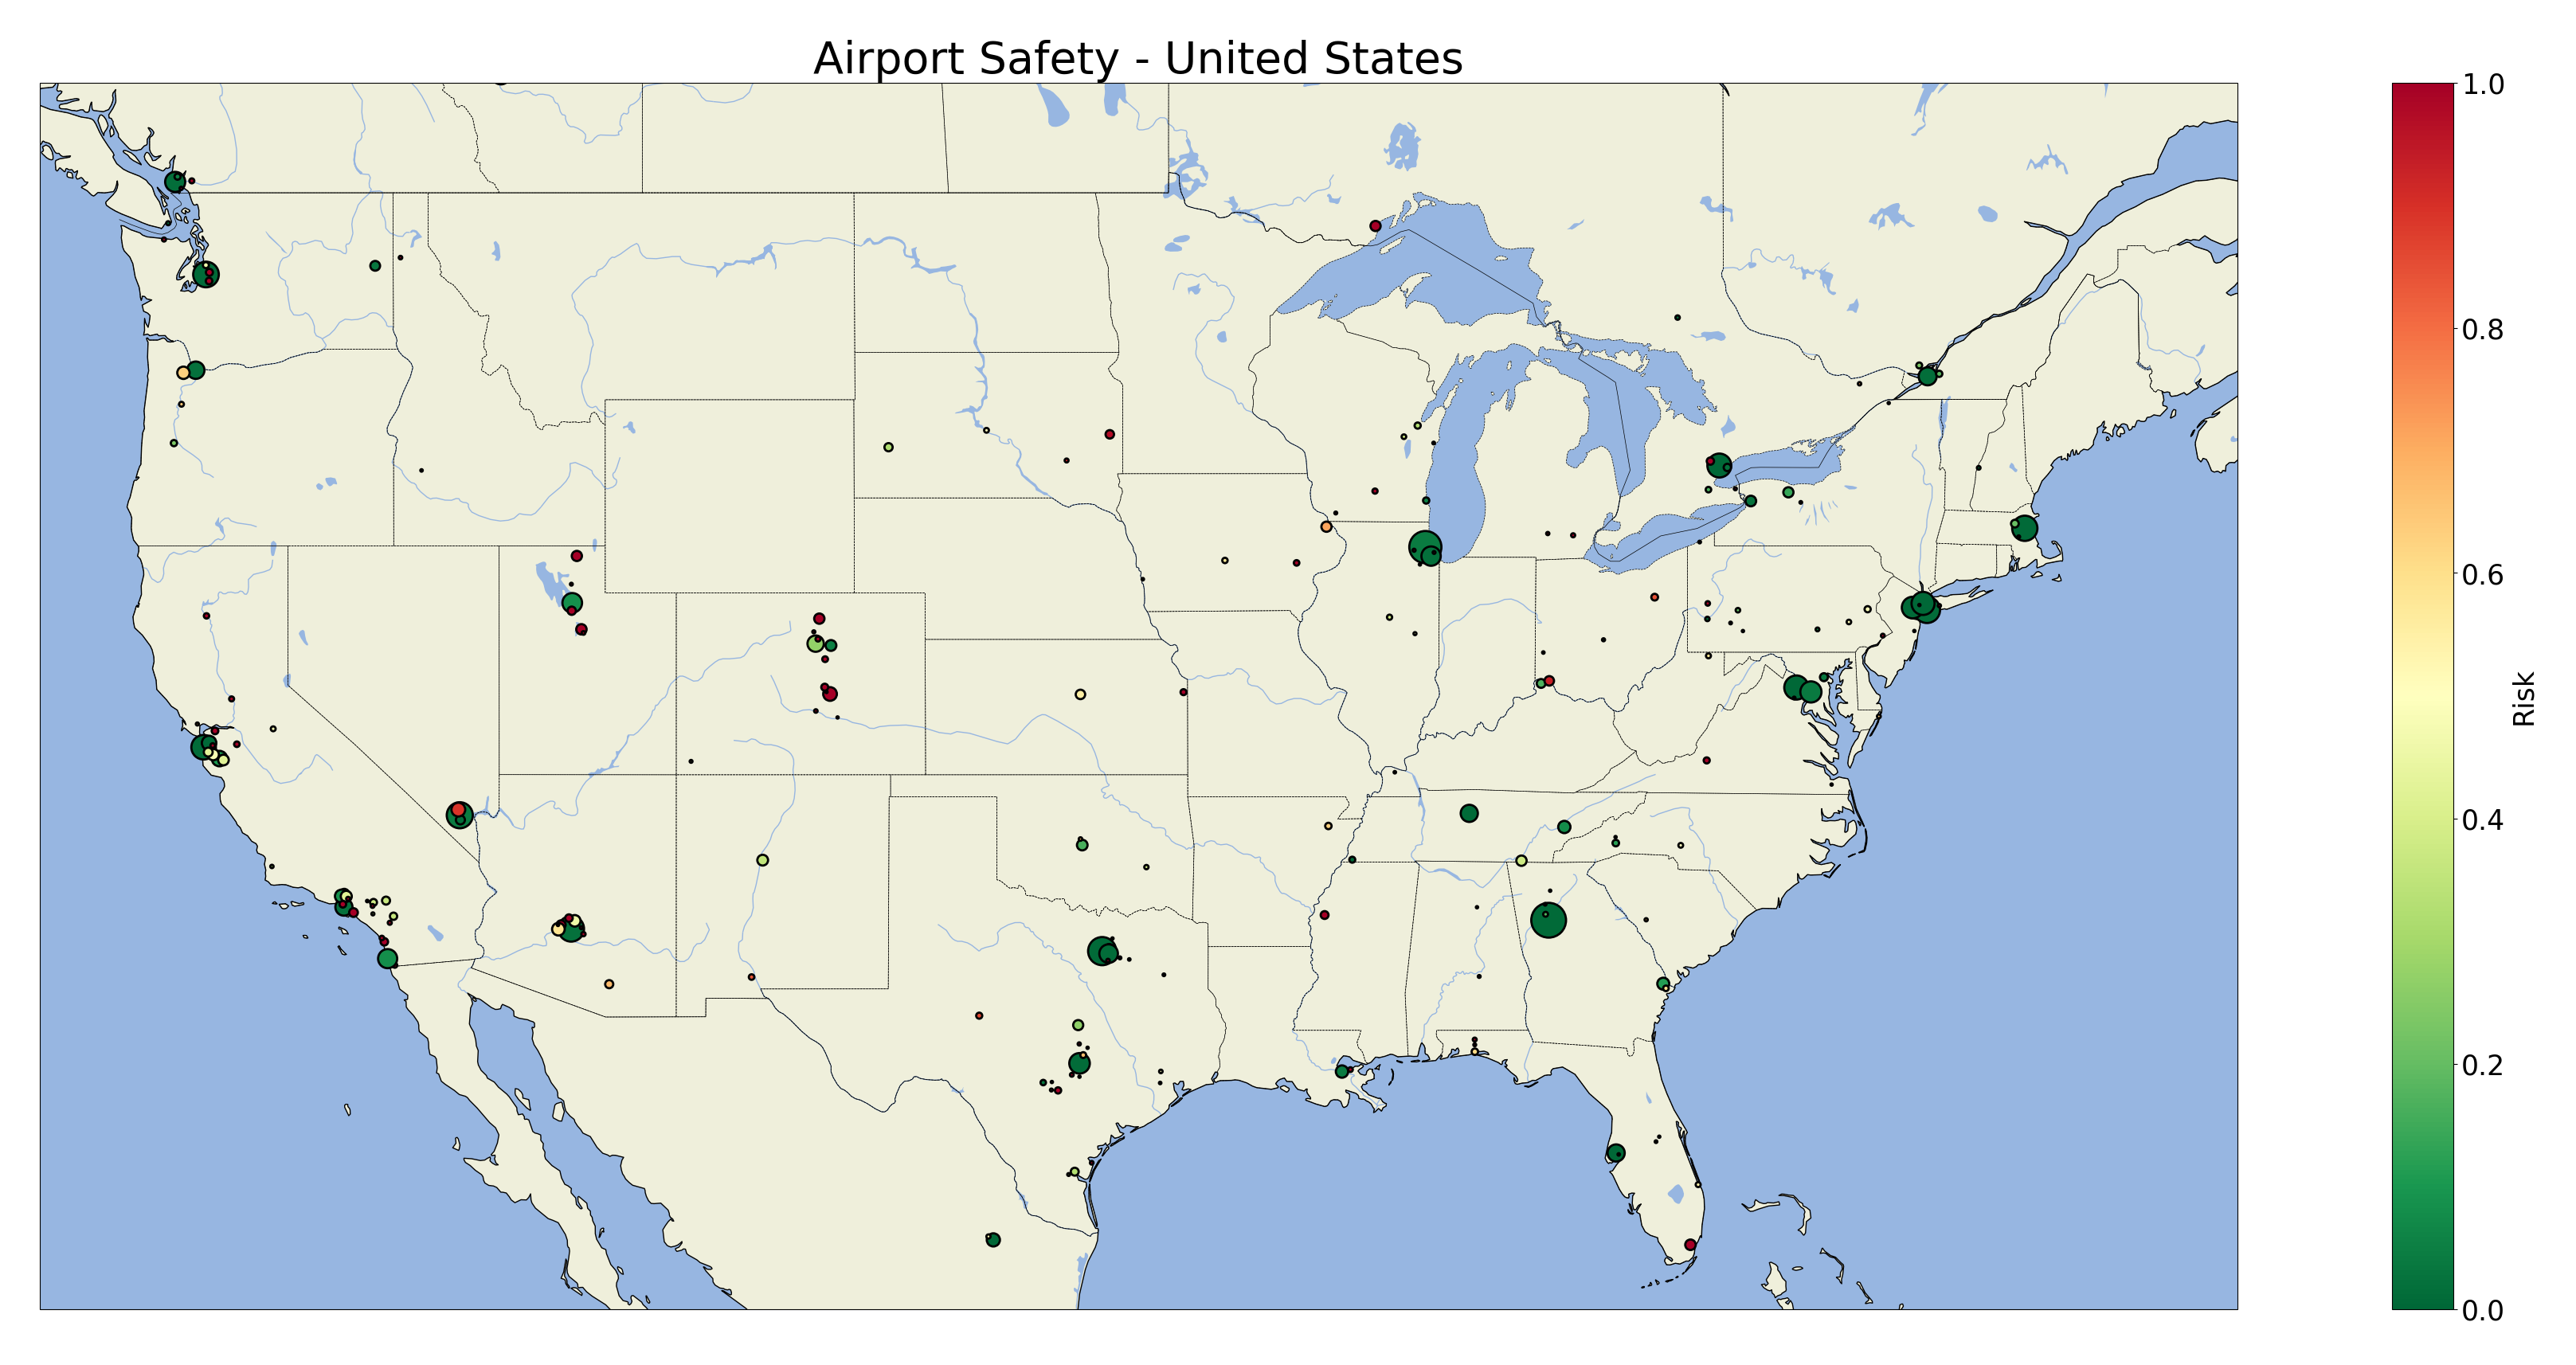
Most major airports have very low risk factors, as expected. However, in Europe, London Heathrow Airport is a notable exception with relatively high risk. This unexpected result persisted across several days of observation. It is unclear whether this is a reality or an artifact of Fleet’s definition and calculation of risk.
The results for the United States are similar. The largest airports seem very safe, but there are a few mid-size airports with significant risk factors, particularly in the western part of the country.
High risk factors are typical for small airports. This could be due to a lack of modern automation for precision landings, such as ILS (Instrument Landing System), or because the typical flights to these airports follow less strict plans. Perhaps the criteria for considering an altitude minimum to be a go-around (maximum altitude AGL and airport distance) should depend on airport size.
Miscellaneous visualizations
For source code and documentation, please visit Fleet’s repository.